LCA results & interpretation AFT Carbon Smart™ Loose-Fill Cellulose Insulation
Scope and summary
- Cradle to gate
- Cradle to gate with options
- Cradle to grave
Application
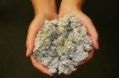
Carbon Smart™ Loose-Fill Cellulose Insulation is made from any cellular plant source although it typically comes from waste paper products. It is installed by using an insulation blowing machine. Carbon Smart™ Loose-Fill Cellulose Insulation is typically applied to enclosed areas, unfinished attic floors, and other hard to reach places.
Functional unit
Reference service life: 75 years. One square meter of installed insulation material, packaging included, with a thickness that gives an average thermal resistance of RSI=1m2·K/W over a period of 75 years. ASTM C518 was used to determine R-value.
Reference flow range: 0.960 kg
Thickness: .0381 m
Density: 25.214 kg/m^3
Manufacturing data
Reporting period: January--December, 2018
Representing 1 location in United States: Bucyrus, OH
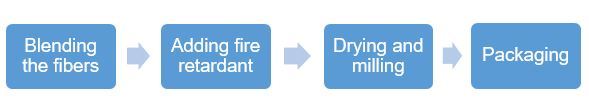
Carbon Smart™ Loose-Fill Cellulose Insulation is produced in several manufacturing steps that involve the blending of fibers, adding the fire retardant in liquid form to the fibers, and then drying and milling the fibers before placing them into plastic bags.
All submitted data were checked for quality multiple times on the plausibility of inputs and outputs. All questions regarding data were resolved with AFT.
Default installation, packaging, and disposal scenarios
At the installation site, insulation products are unpackaged and installed with a blowing machine. The potential impact of the blower is included in this study. Plastic packaging used to wrap final product, is disposed 100% to landfill. No maintenance or replacement is required to achieve the product's life span. After removal, the insulation is assumed to be landfilled, not re-used or recycled.
About CIMA/CIMAC industry-wide EPD results
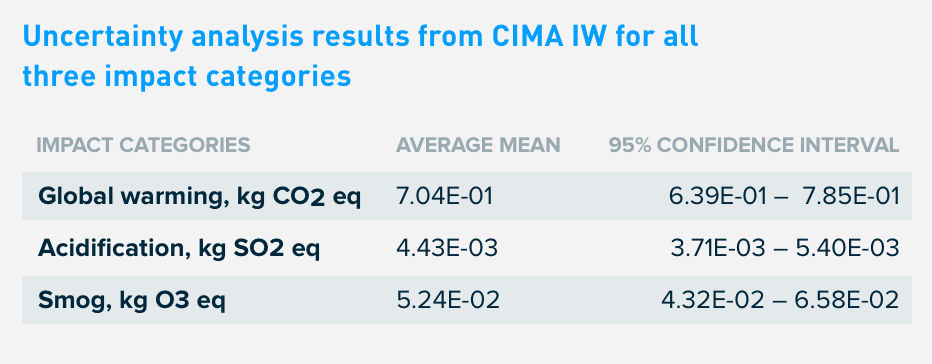
The CIMA/CIMAC industry-wide EPD for Carbon Smart™ Loose-Fill Cellulose Insulation serves as a product group benchmark to which product-specific results can be compared. A Monte-Carlo uncertainty analysis was done to measure how the LCA results, from each product in the industry-wide, vary due to the differences in data inputs and to determine if each product falls within the industry average mean. A 95% confidence level demonstrates confidence that the results are representative of all cellulose insulation manufacturers.
Three impact categories are used for comparison: The PCR requires global warming while acidification and smog were selected because they had the lowest variability as shown by the CIMA/CIMAC Monte-Carlo uncertainty analysis. When a manufacturer compares its product-specific results, if the environmental impact is within the range, it is determined to be equivalent to the industry impact; below the range, lower impact; above the range, higher impact.
What’s causing the greatest impacts
All life cycle stages
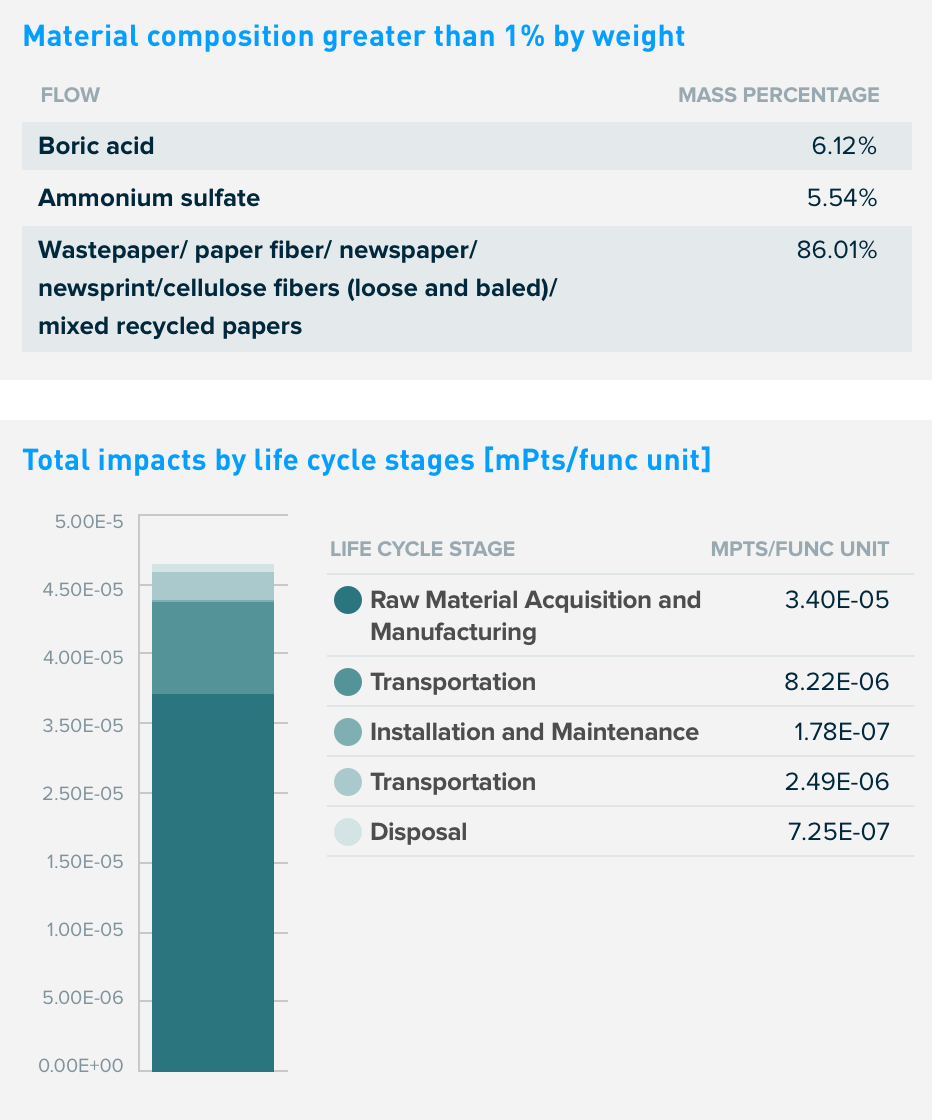
The raw materials acquisition, transportation to the manufacturing facility, and manufacturing stages (A1-A3) dominate the results for all impact categories. This study assessed a multitude of inventory and environmental indicators. These six impact categories are globally deemed mature enough to be included in Type III environmental declarations. Other categories are being developed and defined and LCA should continue making advances in their development, however the EPD users shall not use additional measures for comparative purposes. The overall results are consistent with expectations for insulation product life cycles, as this product is not associated with energy consumption during its use stage. Transportation of the final products to distribution facilities (A4) is the second highest contributor to these impact categories.
The impacts during installation are associated with packaging disposal and the gas and electricity used for an installation blower machine. There is no impact associated with the use stage. While insulation can influence building energy performance, this is outside the scope of this study. Additionally, it is assumed that insulation does not require any maintenance to achieve its reference service life, which is modeled as being equal to that of the building. No replacements are necessary; therefore, results represent the production of one square meter of insulation at a thickness defined by the functional unit.
At the end of life, insulation is removed from the building and land-filled. No substances required to be reported as hazardous are associated with the production of this product.
Raw materials acquisition stage
The raw material acquisition, transportation to manufacturing facility, and the manufacturing stages (A1-A3) dominate the impacts due to the raw materials. Boric acid and ammonium sulfate, used as fire retardants, are the main contributors. Emissions from transportation (A2) of raw materials and wastepaper to manufacturing facility contribute mainly to fossil fuel depletion, ozone depletion and global warming.
The results show that the largest opportunity for reduction of the products' environmental impacts, is in the raw material acquisition and manufacturing phase. This can be done by using alternative materials, reducing transportation distance, turning off certain machines when they are not in use, and recycling dust emissions back into the product to reduce manufacturing impacts.
How our product compares to the industry benchmark
Interpretation summary
In January 2020, the Cellulose Insulation Manufacturers Association (CIMA) and the Cellulose Insulation Manufacturers Association of Canada (CIMAC) published an industry-wide Type III EPD in which AFT participated; it followed both the UL PCR and SM Part B benchmarking addendum that enables comparison of a product-specific EPD to the industry benchmark. The SM Part B benchmarking addendum requires the selection of the greatest improvement and lowest performing impact categories.
Carbon Smart™ Loose-Fill Cellulose Insulation LCIA results show environmental performance improvements across all impact categories evaluated in this study except for non-carcinogenics. The impacts are due to stages A1-A3 as follows:
- A1 Boric acid and ammonium sulfate
- A2 Transportation of boric acid and ammonium sulfate
- A3 Electricity consumption during manufacturing
Electricity consumption during manufacturing does not contribute significantly to the overall impacts of A1-A3, but becomes significant when comparing to industry average results and identifying the contributors to performance improvement.
Comparison of impact categories from industry-wide EPD based on uncertainty analysis
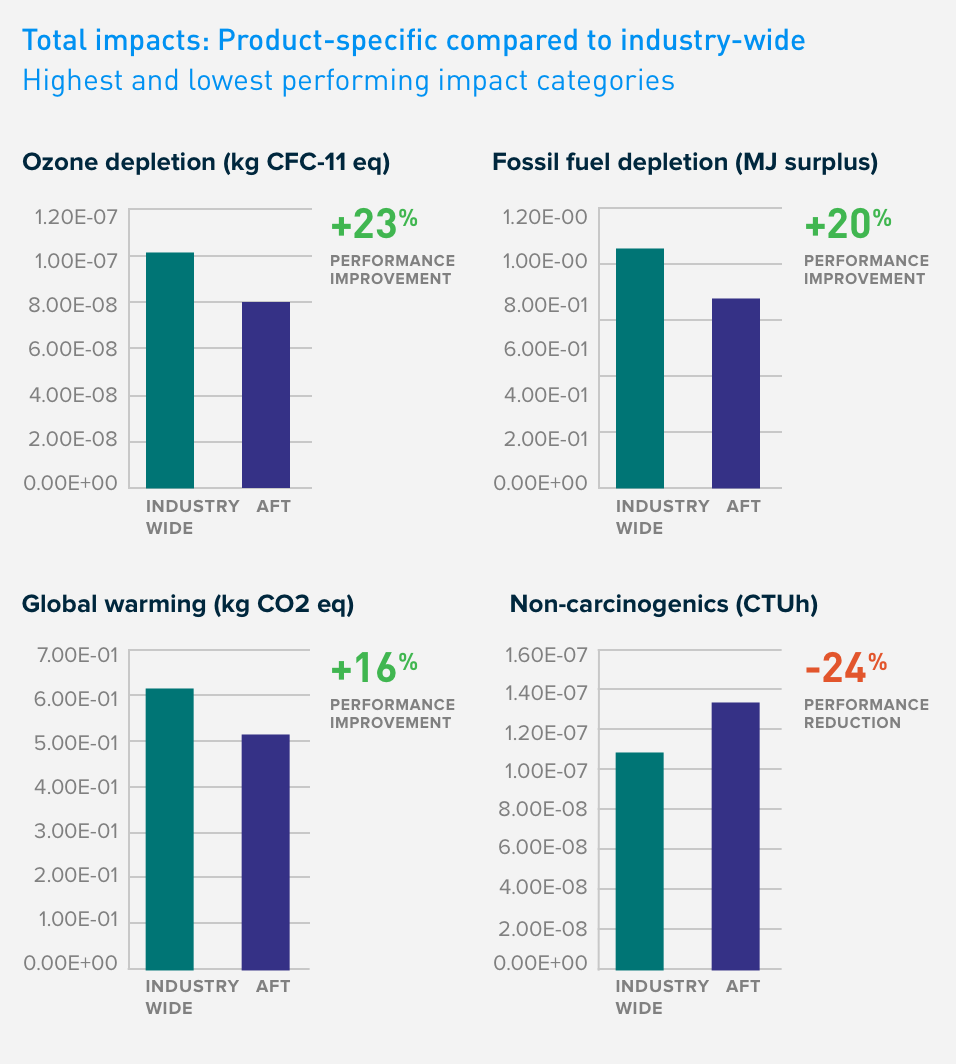
- 16% improvement: Global warming
- 7% improvement: Acidification
- 16% improvement: Smog
The global warming improvement is a result of the absence of cardboard box as a material ingredient which is commonly used by other cellulose insulation manufacturers. The impacts for the other two categories come from boric acid (A1), ammonium sulfate (A1), transportation (A2), and electricity (A3). Electricity consumption during manufacturing is lower than the industry average.
Greatest improvement impact categories (lower impact results than average)
- 23% lower: Ozone depletion
- 20% lower: Fossil fuel
Carbon Smart™ Loose-Fill Cellulose Insulation has better environmental performance in these impact categories than the industry average results but does not represent that the AFT insulation is better than any specific manufacturer participating in the industry average.
Lowest performing impact category (higher impact results than average)
- 24% higher impacts in this category: Non-carcinogenics
Non-carcinogenics is the only category where impacts were greater than the industry average. Zinc sulfate, used as a fire retardant, contributes 50% of the impacts to this category. Other cellulose insulation manufacturers do not include zinc sulfate as a material ingredient.
How we're making it greener
AFT has entered into a carbon free power purchase agreement starting in 2021 to continue on the path of creating a low embodied carbon product by reducing impacts during manufacturing.
Cellulose insulation has very low embodied carbon due to the use of recycled raw material content, low embodied energy during manufacturing, and carbon sequestration.
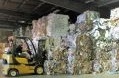
- Cellulose insulation is recyclable because it is made with 85%, or more, recovered content, most of which is post-consumer. A medium size cellulose insulation plant will convert three to five truckloads, or more, of recovered paper to energy-saving insulation each production shift.
- The energy used to make cellulose insulation is referred to as embodied energy. It includes the energy required to transport raw materials, manufacture and distribute the product. Using mostly locally sourced materials manufactured in electrically-driven mills, which can be shut down between production runs and do not need to run 24x7, cellulose insulation is an extremely energy efficient product to produce.
- Since the primary feedstock -- recovered paper fibers -- is derived from trees, cellulose insulation sequesters carbon in the walls and ceilings of homes for the life of the building.
LCA results
| Life cycle stage | A1-A3 Raw material acquisition and manufacturing | A4 Transportation | A5, B1-B7 Installation and maintenance | C2 Transportation | C4 Disposal/reuse/ recycling |
|
Information modules: Included | Stages C1, C3, and D are excluded. In the installation and maintenance phase, packaging waste and electricity or gas used by the insulation blowing machines in module A5 are the only contributors to the potential impacts. |
A1 Raw Materials | A4 Transporation/ Delivery | A5 Construction/ Installation | C2 Transportation | C4 Disposal |
| A2 Transportation | B1 Use | ||||
| A3 Manufacturing | B2 Maintenance | ||||
| B3 Repair | |||||
| B4 Replacement | |||||
| B5 Refurbishment | |||||
| B6 Operational energy use | |||||
| B7 Operational water use | |||||
 |
 |
 |
SM Single Score
Learn about SM Single Score results| Impacts per 75 years of service | 3.40E-05 mPts | 8.22E-06 mPts | 1.78E-07 mPts | 2.49E-06 mPts | 7.25E-07 mPts |
| Materials or processes contributing >20% to total impacts in each life cycle stage | Boric acid and ammonium sulfate used in the production of the insulation. | Truck and trailor transportation used to transport product to manufacturing site. | Transportation to disposal, energy required for installation with a blowing machine, and disposing of packaging materials. | Transportation to landfill. | Landfilling of product. |
TRACI v2.1 results per functional unit
| Life cycle stage | Raw material acquisition and Manufacturing | Transportation | Installation and maintenance | Transportation | Disposal/reuse/ recycling |
Ecological damage
Human health damage
Additional environmental information
| Impact category | Unit | Product | Industry | Product | Industry | Product | Industry | Product | Industry | Product | Industry |
| Respiratory effects | kg PM2.5 eqKilograms of Particulate Matter equivalent which are smaller than or equal to 2.5 micrometers in diameter Particulate matter concentrations have a strong influence on chronic and acute respiratory symptoms and mortality rates. |
3.38E-04 | 3.91E-04 | 5.90E-05 | 6.09E-05 | 9.86E-07 | 4.89E-07 | 1.79E-05 | 1.78E-05 | 8.07E-06 | 8.23E-06 |
| Ecotoxicity | CTUe Comparative Toxic Units of Ecotoxicity Ecotoxicity causes negative impacts to ecological receptors and, indirectly, to human receptors through the impacts to the ecosystem. |
5.10E-01 | 8.95E-01 | 3.51E-01 | 4.50E-01 | 4.01E-03 | 8.77E-03 | 1.06E-01 | 1.61E-01 | 1.12E-02 | 1.73E-02 |
| Fossil fuel depletion | MJ surplus Mega Joule, lower heating value Fossil fuel depletion is the surplus energy to extract minerals and fossil fuels. |
5.87E-01 | 7.99E-01 | 1.77E-01 | 1.83E-01 | 4.65E-03 | 3.88E-03 | 5.36E-02 | 5.33E-02 | 2.60E-02 | 2.65E-02 |
References
AFT LCA Background Report
AFT Loose-Fill Cellulose Insulation Products LCA Background Report (public version), AFT 2020. SimaPro Analyst 9.0.0.49, ecoinvent 3.1, 2.2 database.
CIMA/CIMAC LCA Background Report
CIMA and CIMAC Loose-Fill Cellulose Insulation Products LCA Background Report (public version), CIMA and CIMAC 2019. SimaPro Analyst 8.5.2.0, ecoinvent 3.1, 2.2 database.
CIMA/CIMAC Transparency Report (EPD)
This industry-wide EPD is the product group benchmark to which product-specific EPDs can be compared. It was done in conformance with the benchmarking guidance provided in the PCR, UL Building Envelope Thermal Insulation 04/18 – 02/23; and the SM Part B: Benchmarking Addendum | Carbon Smart™ Loose-Fill Cellulose Insulation. Manufacturers interested in participating retroactively or making product-specific EPD comparisons, see the Benchmarking Addendum for instructions or contact Sustainable Minds.
PCRs
ISO 21930:2017 serves as the core PCR along with EN 15804 and UL Part A.
ULE PCR Part A: Life Cycle Assessment Calculation Rules and Report Requirements v3.1
May 2, 2018. Technical Advisory Panel members reviewed and provided feedback on content written by UL Environment and USGBC. Past and present members of the Technical Advisory Panel are listed in the PCR.
ULE PCR Part B: Building Envelope Thermal Insulation
Version 2.0, April 2018. PCR review conducted by Thomas Gloria, PhD (chair, [email protected]); Andre Desjarlais; and Christoph Koffler, PhD.
ISO 14025, “Sustainability in buildings and civil engineering works -- Core rules for environmental product declarations of construction products and services”, ISO21930:2017
Download SM Transparency Report (EPD), which includes the additional EPD content required by the UL Environment PCR.
SM Transparency Reports (TR) are ISO 14025 Type III environmental declarations (EPD) that enable purchasers and users to compare the potential environmental performance of products on a life cycle basis. They are designed to present information transparently to make the limitations of comparability more understandable. TRs/EPDs of products that conform to the same PCR and include the same life cycle stages, but are made by different manufacturers, may not sufficiently align to support direct comparisons. They therefore, cannot be used as comparative assertions unless the conditions defined in ISO 14025 Section 6.7.2. ‘Requirements for Comparability’ are satisfied. Comparison of the environmental performance of building envelope thermal insulation using EPD information shall be based on the product’s use and impacts at the building level, and therefore EPDs may not be used for comparability purposes when not considering the building energy use phase as instructed under the PCR. Environmental declarations from different programs (ISO 14025) or based upon differing PCRs may not be comparable. Full conformance with the PCR for building envelope thermal insulation allows EPD comparability only when all stages of a life cycle have been considered, when they comply with all referenced standards, use the same sub-category PCR, and use equivalent scenarios with respect to construction works. However, variations and deviations are possible. Example of variations: Different LCA software and background LCI data sets may lead to different results upstream or downstream of the life cycle stages declared. Compliance with model building codes does not always ensure compliance with state or local building codes, which may be amended versions of these model codes. Always check with local building code officials to confirm compliance. LCIA results are relative expressions and do not predict impacts on category endpoints, the exceeding of thresholds, safety margins or risks. Limitations to this study is that not all manufactures in N.A. participated in the industry-wide study to which the AFT results were compared; furthermore, results for AFT product specific come from same original data that was used to calculate results for AFT for the industry wide EPD.
The comparative assessment is considered valid for at least three years from the verification start date as per LEED V4.1 beta requirements.
