Embodied energy/global warming payback demonstration using Knauf products
See how fast it is to recover the energy used to make Knauf products when they’re put into a building.
Embodied energy in manufacturing drives global warming impacts. Use this model to help make the case for insulating a building by comparing the amount of energy saved over the building lifetime relative to the amount used to manufacture.
Select climate zone to display payback model.
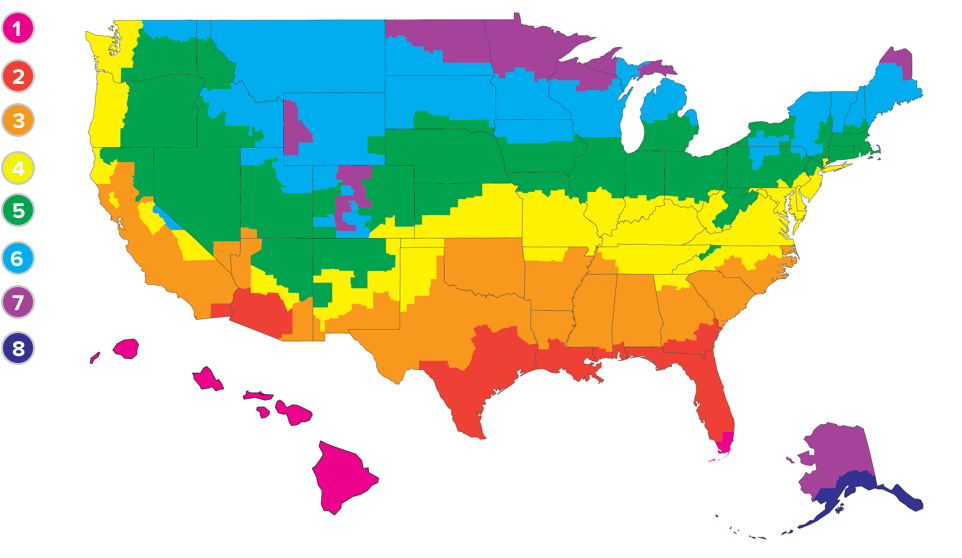
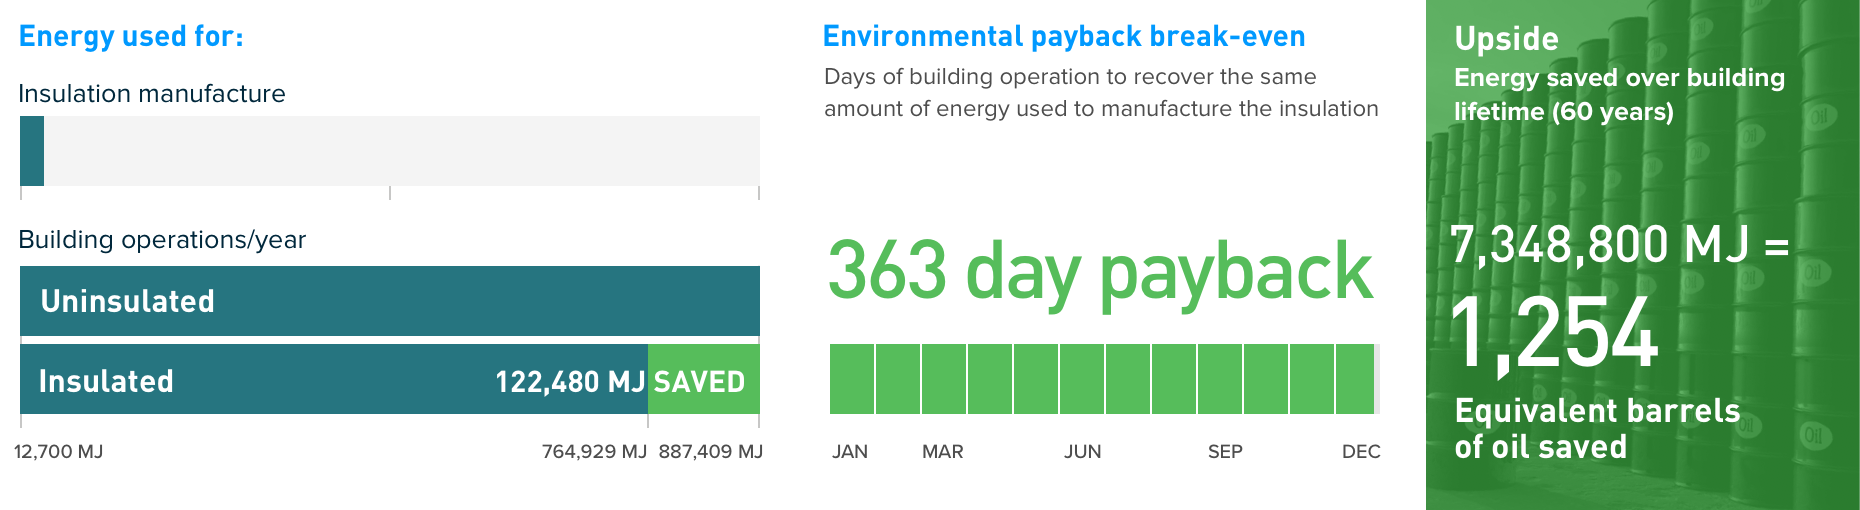
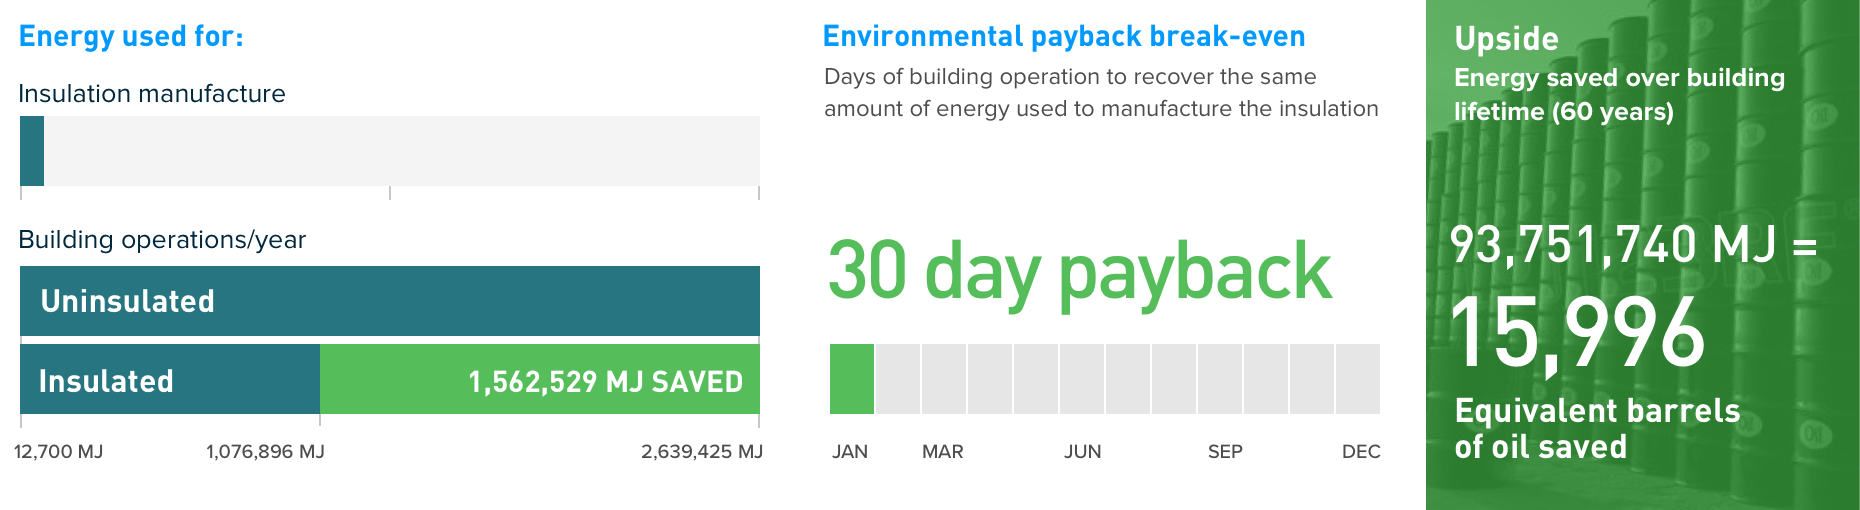
1 Climate zone 1
Environmental payback of energy used to manufacture the amount of product needed to insulate a typical 30,000 sq. ft. building
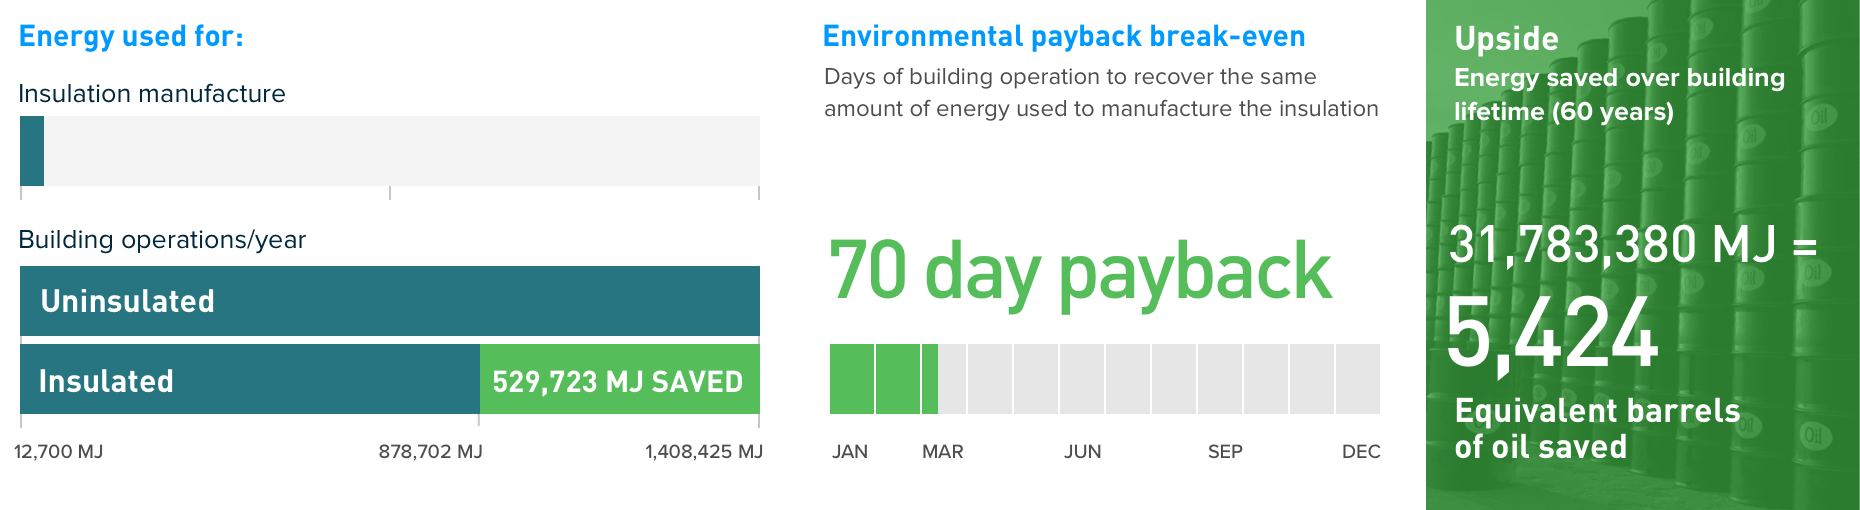
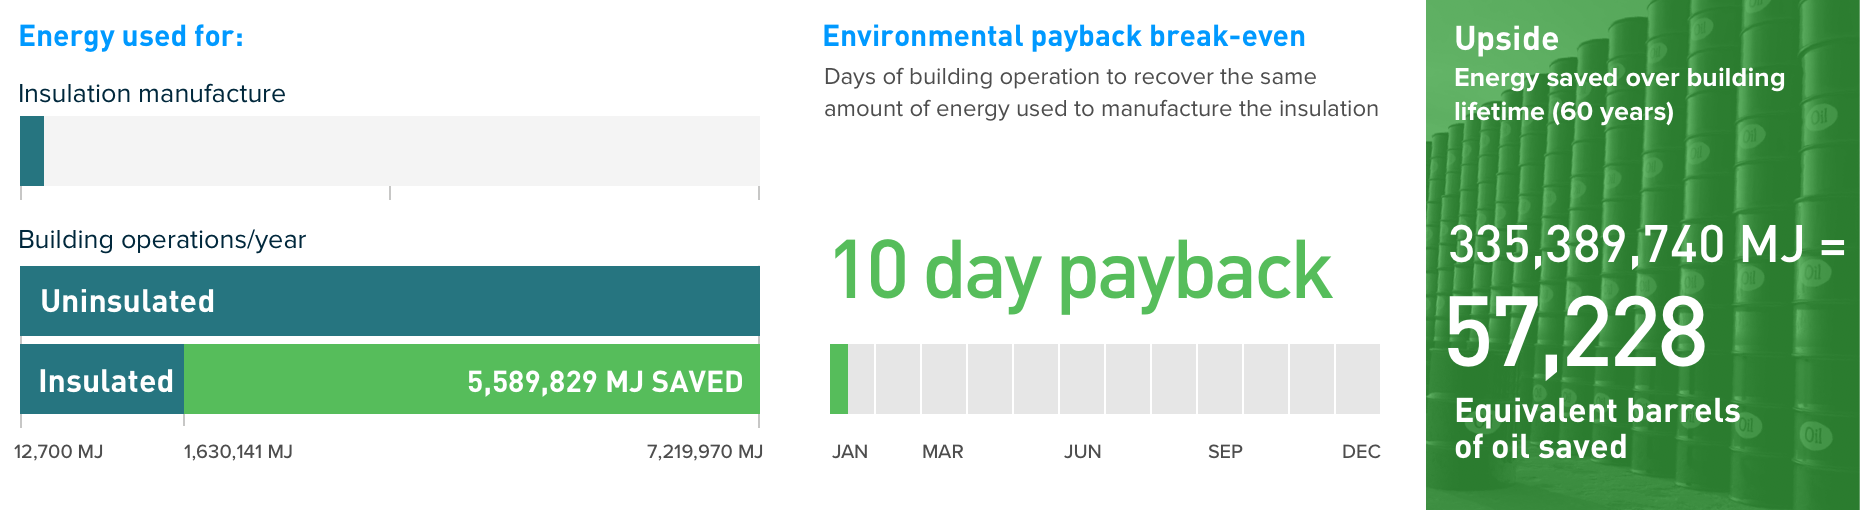
2Climate zone 2
Environmental payback of energy used to manufacture the amount of product needed to insulate a typical 30,000 sq. ft. building

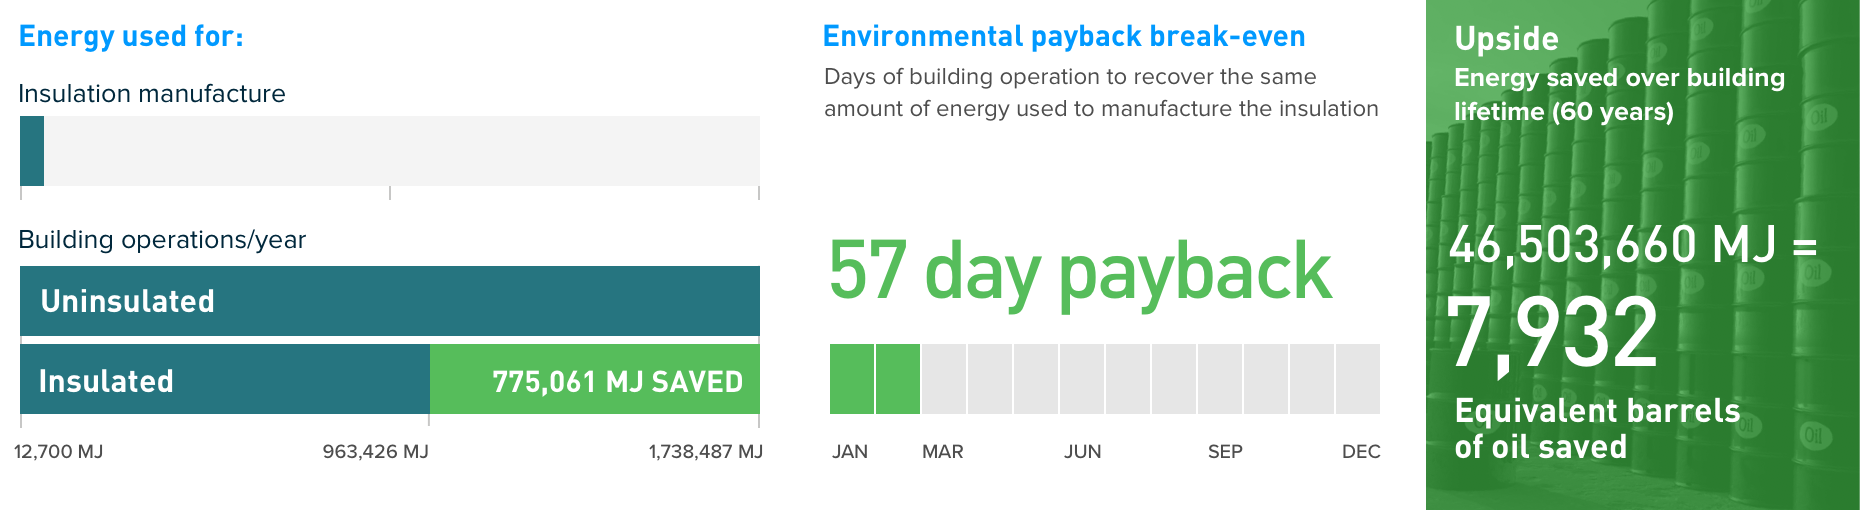
3Climate zone 3
Environmental payback of energy used to manufacture the amount of product needed to insulate a typical 30,000 sq. ft. building
4Climate zone 4
Environmental payback of energy used to manufacture the amount of product needed to insulate a typical 30,000 sq. ft. building
5Climate zone 5
Environmental payback of energy used to manufacture the amount of product needed to insulate a typical 30,000 sq. ft. building
6Climate zone 6
Environmental payback of energy used to manufacture the amount of product needed to insulate a typical 30,000 sq. ft. building

7Climate zone 7 8Climate zone 8
Environmental payback of energy used to manufacture the amount of product needed to insulate a typical 30,000 sq. ft. building
Calculation methodology:
embodied energy/global warming payback
The intention of this calculation is to show the environmental benefit of insulation in a relational way. Hence, the specific location used within a climate zone (CZ) may not be exactly the same as your specific location.
About environmental payback break-even
The payback we show is only the environmental payback of global warming. The reason we are not showing the payback of both embodied energy and global warming is that they are very close to each other, as embodied energy is the primary contributor to global warming. The reason we chose to show global warming payback is that it encompasses all contributors to global warming, not just those from embodied energy, so it is the more conservative payback estimate.
Example comparison of payback periods for an:
1. Uninsulated building
2. Insulated building using R-15 loosefill wall insulation and R-38 ceiling insulation
| Payback for embodied energy |
Wall insulation R-value |
Ceiling insulation R-value |
Total building operation energy it takes to heat and cool building per year (MJ) |
Energy saved by using insulation per year (MJ) |
Total energy
it takes to manufacture insulation (MJ) |
Environmental payback break-even Days of building operation to recover the same amount of energy used to manufacture the insulation |
|---|---|---|---|---|---|---|
| Uninsulated | None | None | 203,000 | None | None | None |
| Insulated | R-15 | R-38 | 103,000 | 100,000 | 21,600 | 79 Days |
| Payback for global warming |
Wall insulation R-value |
Ceiling insulation R-value |
Carbon footprint to heat and cool building p/yr (kg CO2-eq) |
Carbon footprint reduced p/yr from using insulation (kg CO2-eq) |
Total carbon footprint from manufacturing insulation (kg CO2-eq) |
Environmental payback break-even Days of building operation to recover the same amount of energy used to manufacture the insulation |
|---|---|---|---|---|---|---|
| Uninsulated | None | None | 12,200 | None | None | None |
| Insulated | R-15 | R-38 | 6,210 | 6,000 | 1,350 | 82 Days |
|
Data source: Primary energy demand (PED) and global warming potential (GWP) data for calculations comes from Knauf product life cycle assessments as reported in its 3rd party verified Type III environmental declarations. Tool: Seventhwave® ‘BACK-OF-THE-ENVELOPE CALCULATOR’ Version 2.0 software was the surrogate for simulated building energy performance. http://seventhwave.org/boecalc |
||||||
Modeling assumptions
- A four story, 30,000 square foot building is evaluated in each climate zone. Assumed building lifetime is 60 years.
- A wood framed structure was used to eliminate the influence of other insulations used on the exterior of typical metal-framed buildings.
- The R-Value and associated U-Value installed for the insulated case in a given climate zone (CZ) is representative of the local code requirement.
- The R-Value and associated U-Value for the uninsulated case in a given CZ is set at R=3 to represent framing, sheathing and siding, with air film coefficients.
- The glazing to wall area was consistent for the CZ of interest and ranged from 15 to 40% of the wall area.
- Ventilation is adjusted to meet code requirements.
- Person density for the building is set at 150. Occupancy time was set at 60 hours per week.
- Lighting power density, plug load density and HVAC efficiencies are adjusted typical of the code requirements for the CZ considered.
Questions regarding these calculations should be directed to [email protected]
- The glazing to wall area was consistent for the CZ of interest and ranged from 15 to 40% of the wall area.
- Ventilation is adjusted to meet code requirements.
- Person density for the building is set at 150. Occupancy time was set at 60 hours per week.
- Lighting power density, plug load density and HVAC efficiencies are adjusted typical of the code requirements for the CZ considered.
Questions about calculations? Contact Scott Miller